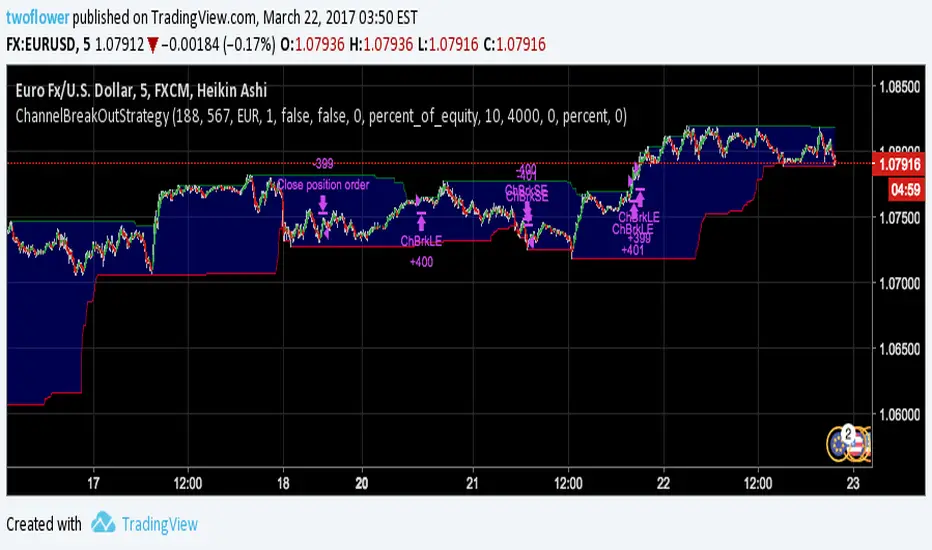
Channel Break Out Binary StrategyI am learning pine script at the moment and this is my first attempt at creating an expire time based strategy for binary options based on a simple example like the built-in Channel Break Out Strategy.
In den Scripts nach "binary option" suchen
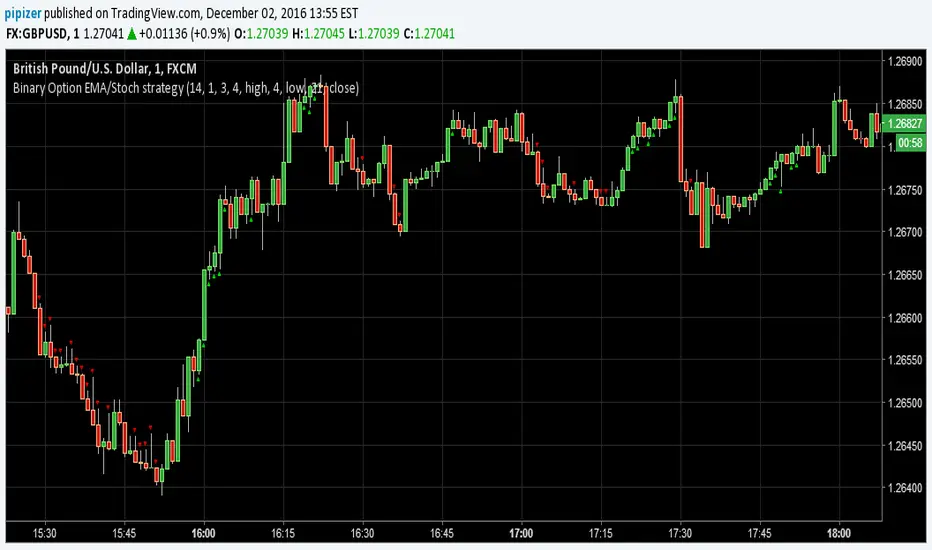
Binary Option EMA/Stoch strategyThis is new Binary Option strategy more signals are generated 60% to 65% win ratio
Binary Options Tester w/ Vdubus money managementAdded implementation of vdubus's money management strategy to binary options tester. As before, the entry/exit strategy is just there for an example, modify go_down and go_up for your strategy as the short and long entry points. Also as before, do not use present variables (i.e. close, close , ema_6_min in the example) in go_up and go_down, as this is akin to having future information. Calling past forms of compound present variables (ema(close,6) ) is fine.

Implied Volatility Rank & Model-Free IVRThis is an update to my previous IV Rank & IV Percentile Script.
I originally made this script for binary/digital options, but this also can be used for vanilla options too.
There are two lines on this script, one plotting Model-Based IV rank and Model-Free IV Rank.
How it works:
Model-Based IV Rank:
1. Take whatever timeframe you're using and multiply it by 252. This is done because typically IV is calculated over a year, which has 252 days. But this can be used for any timeframe, so just multiply you're timeframe by 252. In the picture above I'm using a 30 min chart, so I multiplied 30 min by 252 and got 7 days, 14 hrs , and 30 min.
2. Next input the result you got from step 1 into the corresponding input boxes.
3. Then input the timeframe you are using into the input box labeled timeframe. I'm using 30 min so I put 30.
4.Finally choose the delta that you want to use and input its standard deviation into the input box. There is a list of common deltas and their corresponding standard deviations in the menu so you don't have to go looking them up. Typically 16D or 1 standard deviation is used when calculating IV, but you can choose whichever one you want.
*FYI. For people trading binary/digital options, the delta of a vanilla option is the same as the price of a binary/digital option. This is because the delta is the first-order mathematical derivative of the vanilla option's price, and a binary/digital option is a mathematical derivative of a vanilla option. So when you see the list of deltas and their corresponding standard deviations values, just know that 40D=$40 binary, 30D=$30 binary, 20D=$20 binary, and so on. But again typically the 16D or $16 binary's standard deviation value would be used*
This calculation of IV rank is useful for vanilla option traders who use Tradingview and don't have access to this metric.
This calculation of IV rank is useful for binary/digital option traders using Tradingview because the only two regulated binary options exchanges: the CBOE and Nadex, do not offer advanced options data, such as IV rank. On the CBOE and Nadex only the market-makers have this data, which they get from their own in-house pricing models. So at least now any binary option traders can have the same data as the market makers that they are trading against. Also if your wondering how accurate my pricing model is; just know that I have have compared the prices given by the pricing model to realtime prices on Nadex (live account) and the prices that my model shows for differing strike prices matches the prices that the market-makers set. So the pricing model, upon which this IV rank is based, is accurate.*
Model-Free IV Rank:
This IV Rank is based off the VixFix and just ranks the VixFix's values over the past 252 periods. In the menu you can see the recommended periods for calculating the VixFix, with 22 being the one most people use. This is the exact same methodology used in my original IV Rank script.
Which should you use?
This is up to you and each have their own pros and cons.
The main pro of using the model-free version is that because it does not rely on a pricing model, it does not take as many steps to calculate IV and therefore can update its IV projections much quicker than the model based approach. This is why if you zoom out the model-free version will have a more choppy appearance than the model based.
The main pro of using the model based version is that this is what the overwhelming majority of options traders use, and can be applied to any option delta you want, while the model-free version only calculates IV rank on the 16D aka $16 binary aka 1 standard deviation strike.

Configurable BB+RSI+Aroon strategy backtest for binary optionsI wanted to share this strategy that I use myself for binary options trading. After trading binary options for several years I have learned that every single day is unique... assets behave differently every single day. So, when I start the day I want to know which is the optimum combination of parameters in my indicators that will give me the signals I want during the day and I get that by doing a quick backtest of the parameters combination in a specific asset that same day. When trading Binary Options I usually do 3 or 4 trades max per day and, yes, there are moments in which even with the right backtest data the signals fail (I strongly believe that there is no strategy that guarantees 100% success in any type of trade, and this one here is not an exception - but has worked well with some assets). So, here is my contribution to improve your productivity by automating a bit that backtesting part.
How this script works?
It is a simple price crossunder / crossover Bollinger Bands (BB) with a confirmation from RSI overbought / oversold signals and a fast Aroon. You will see the BB plotted with its confirmations:
(1) a blue circle that plots in the chart when the price is coming back inside the channel (within the Bollinger Bands)
(2) an orange square that plots in the chart when the RSI is coming back from the overbought or oversold areas
(3) a triangle that could be red or green depending on the Aroon confirmation: Red if Aroon Down is crossing down Aroon Up or green if vice versa.
The strategy will call for long (Call) if:
(1) the price is crossing over the lower band of the Bollinger Bands, coming back inside the channel
(2) Aroon Up is crossing or has crossed above Aroon Down
(3) RSI is crossing over the oversold limit
Consequently, the strategy will call for a short (Put) if:
(1) the price is crossing down the upper band of the Bollinger Bands, coming back inside the channel
(2) Aroon Down is crossing or has crossed below Aroon Up
(3) RSI is crossing under the overbought limit
You can configure:
1. Aroon length (keep it as fast as possible: 3, 4 or 5 are recommended values)
2. The point where Aroon Up and Aroon Down cross to make the signal valid (50 is by default. It could also be 25 or 75)
3. The RSI length
4. RSI Overbought and Oversold limits (they do not need to be symmetric: you can use 29 and 93, for example)
5. Bollinger Bands length and standard deviation
6. Number of bars to keep your option open. Depending on the timeframe used, this will determine the time you will keep your binary option open. If you are in a 1 min chart and keep this parameter in 3, then you will need to configure your binary option to expire in 3 minutes.
How to evaluate your backtest?
In Binary Options you only need the success rate, so what I do is that when I am manually updating the parameters I keep my strategy tester window open checking the winning trades vs losing trades ratio ("Percent Profitable"). I personally will only keep an asset monitored looking for signals that day if the Percent Profitable on the backtest of the same day is above 80%.
Regarding the code: it is open, public and free. No need to ask for permission if you want to copy+paste and use it in whole or parts.
Happy pip hunting!
-marco

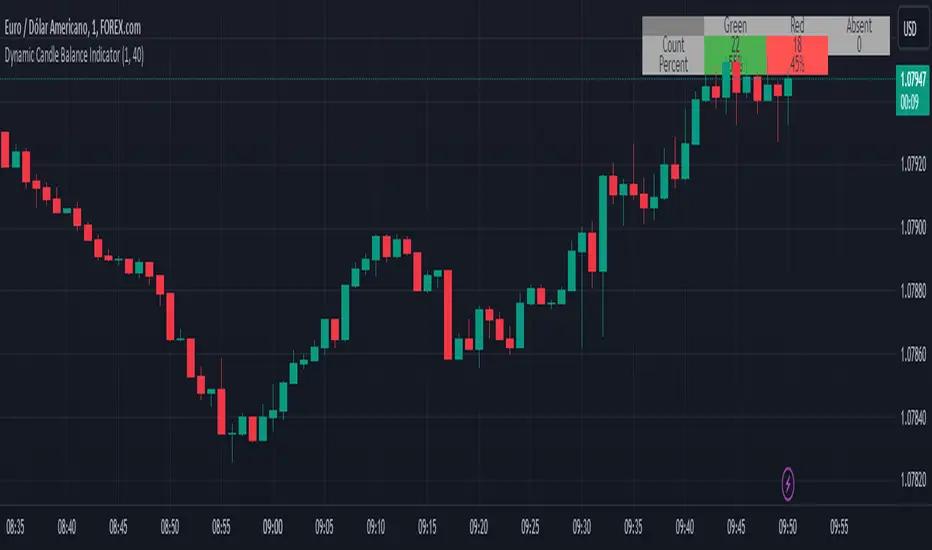
Dynamic Candle Balance Indicator (Binary)
Dynamic Candle Balance Indicator
The Dynamic Candle Balance Indicator is a powerful tool designed to identify imbalances in candle colors on a chart, which can indicate potential reversals or changes in market direction. This indicator is specifically developed for traders operating on short timeframes, such as 1-minute candles, and is particularly useful for identifying opportunities in binary options.
How to Use:
Set Parameters
Initial Position: Specify the number of initial candles to be considered for calculation.
Count: Determine the total number of candles to be analyzed, including the initial position.
Interpret Results:
Green: Indicates the number of bullish candles (where the closing price is higher than the opening price).
Red: Indicates the number of bearish candles (where the closing price is lower than the opening price).
Absent: Indicates the number of candles that were not considered due to the selected interval.
Performance Analysis:
The indicator calculates the percentage of green and red candles relative to the total number of analyzed candles, providing insights into market balance or imbalance.
Identify Trading Opportunities:
Significant imbalances between candle colors can indicate potential reversals or changes in market direction.
Traders can use this information to make informed decisions about their trading strategies, such as identifying entry or exit points.
Example:
In the last 40 candles, there were 13 green candles and 27 red candles, indicating a higher likelihood of the next candle being green.
Usage Tips:
The indicator is most effective when used on a 1-minute timeframe for binary options trading, especially during periods of high imbalance.
Adjust the parameters according to your trading strategy and the timeframe being analyzed.
Combine the Dynamic Candle Balance Indicator with other technical analysis tools to confirm trading signals.
Legal Disclaimer:
This indicator is provided for educational and informational purposes only. It represents a theory and should be used as part of a comprehensive trading strategy. Past performance is not indicative of future results. Traders should always conduct their own analysis before making trading decisions.
Try out the Dynamic Candle Balance Indicator and leverage its functionalities to identify trading opportunities on short-term charts, especially in 1-minute timeframes for binary options trading during periods of high imbalance. Remember to test the indicator on a practice account before using it on a real account.
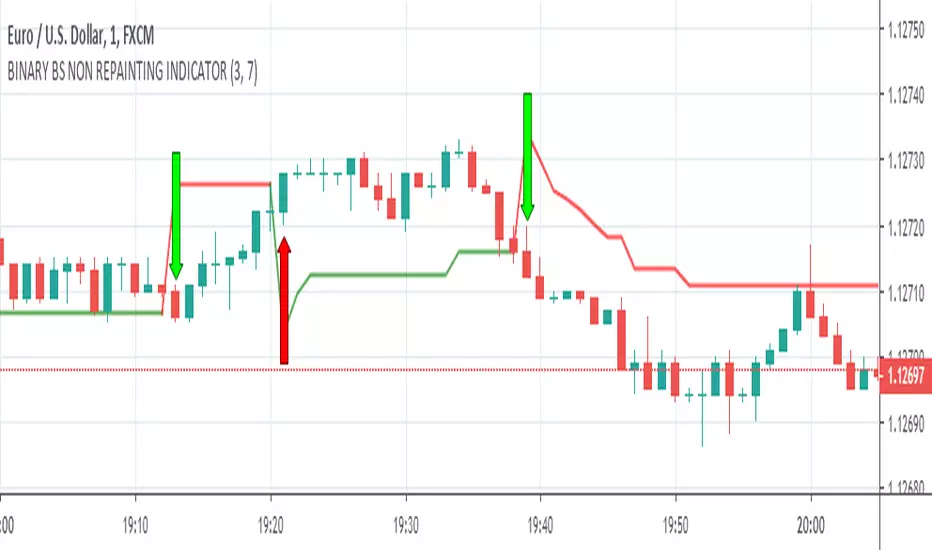
BINARY BS NON REPAINTING INDICATOR
Hello Binary Options traders, do you worry about loss in binary, now no need to worry, search my page in Fb, named "IQ Option Traders PK " ,like my page and send me a message, i will send you details of my strategy free of cost.
or comment below i will respond you.
thanks
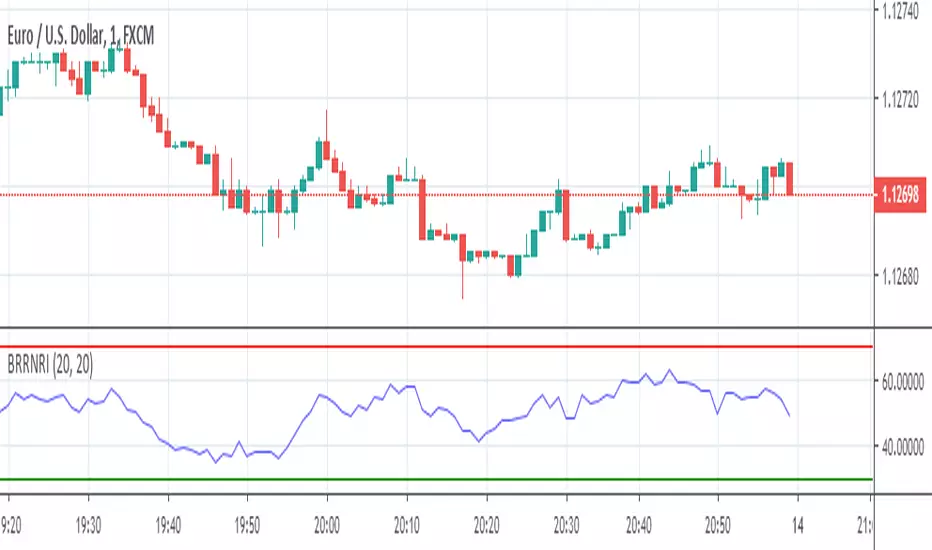
BINARY RR NON REPAINTING INDICATOR
Hello Binary Options traders, do you worry about loss in binary? now no need to worry, search my page in Fb, named "IQ Option Traders PK " ,like my page and send me a message, i will send you details of my strategy free of cost.
or comment below i will respond you.
thanks
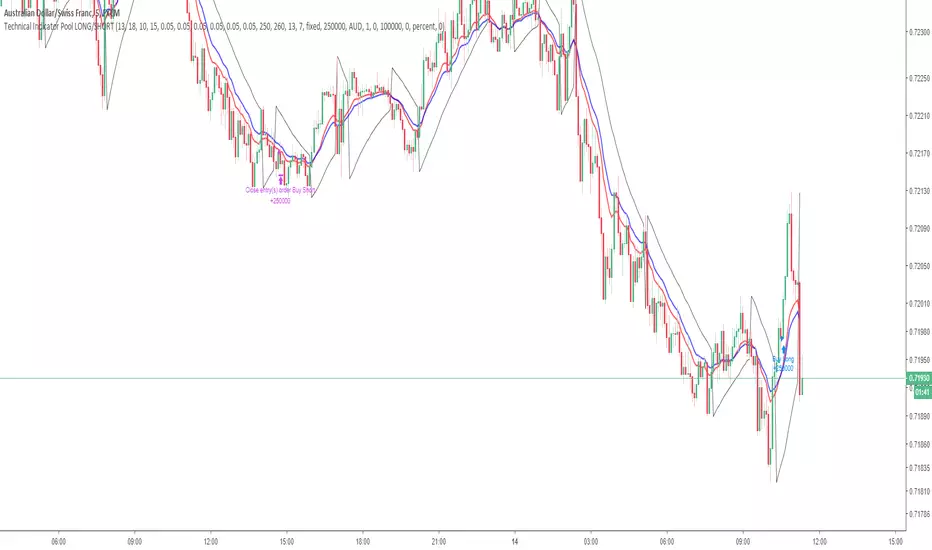
Technical Indicator PoolThis is for Bundle holders who want to use the Technical Indicator Pool for scalping binary options.
Understanding the Technical Indicator Pool
The Technical Indicator Pool is a strategy that operates on the premise that when many technical indicators project the same sentiment, they are concurrently more precise. The technical indicator pool contains five indicators
1. Small MACD Moving Average (SFMA) (10,15)
2. Large MACD Moving Average (LFMA) (13,18)
3. Parabolic Stop and Reverse (PSAR) (0.05, 0.05, 0.05)
4. Relative Strength Index (RSI) (14, 70, 30)
5. H/L Pivot (13)
When all five indicators project the same sentiment within a defined period (known as BarPeriod), an order is placed in the direction of sentiment.
Note:
Due to the nature of the indicator pool, such as the moving averages within the MACD and RSI as well as the High/Low Pivot, false positives may occur before the bar has closed within the time stamp.
This point of reference is to be used in combination with an arsenal of trading tools and should not be used as direct investment advice.
Option strategies should always include stop losses.
This strategy operates using a lot size of 2.5.
RSI2 with alerts by Mr.TuanDoan for Binary OptionIdea was developed from Larry Connors RSI2.
The 2-period RSI strategy is a fairly simple mean-reversion trading strategy designed to buy or sell securities after a corrective period.
You should look for buying opportunities when 2-period RSI moves below Lower Band (5), which is considered deeply oversold. Conversely, you can look for short-selling opportunities when 2-period RSI moves above Upper Band (95).
This is a rather aggressive short-term strategy for Binary Option.
Best use with Stoch RSI x 2.
The settings for Stoch RSI are
- Slow: 3 3 14 14
- Fast: 3 3 5 5
Only consider a PUT/CALL when both Stoch RSI are in the same state (overbought/oversold).
When arrow appears on the candle, it likely reverse the current trend.
Note
This is not a holy-grail.
Please follow your risk management
Confirmations must be met before entering a trade
It's for Binary Option

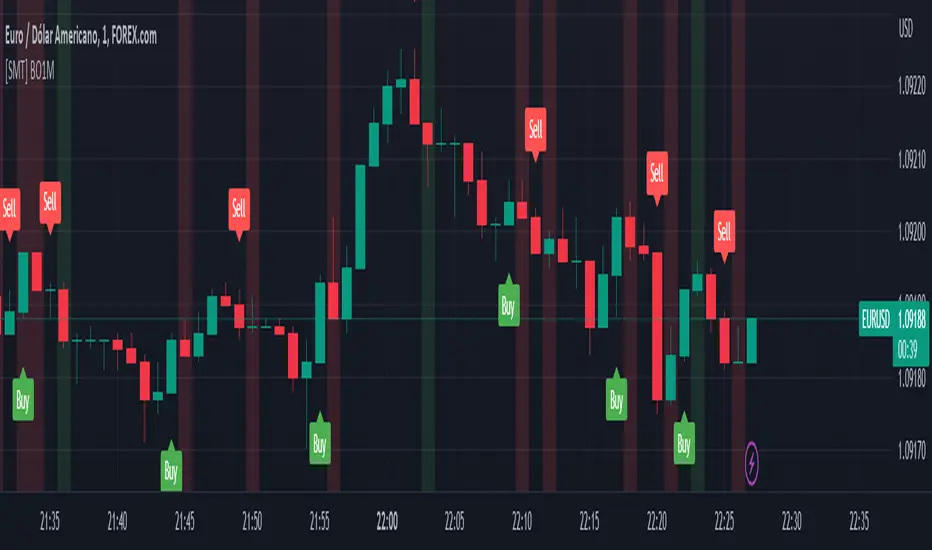
[SMT] Binary Option 1 MinuteThis indicator called " Binary Option 1 Minute" is designed to trade binary options on 1-minute time frames. It is based on two moving averages and a crossover signal. The moving averages used are calculated from the average prices of the last time periods. The first moving average is calculated with a shorter period, while the second is calculated with a longer period.
The signal is generated when the first moving average crosses above or below the second moving average, and then an additional filter is applied. The signal filter is calculated using an exponentially weighted moving average of the difference between the two moving averages. When the signal crosses above the zero line, a buy signal is generated, and when the signal crosses below the zero line, a sell signal is generated.
The indicator plots buy and sell arrows on the chart when a signal is generated. Additionally, it can also display gains and losses in the form of background colors. The green color indicates a gain, and the red color indicates a loss. Finally, the indicator includes sound and text alerts to inform the trader about the generation of a signal.
Attention: This indicator does not repaint! Wait for the candle to close to confirm the entry signal. Remember that signals do not imply guarantees of accuracy or gains. It is highly recommended that you test the indicator on a demo account before using it on a real account.
BO - CCI Arrow with AlertBO - CCI Arrow with Alert base on CCI indicator to get signal for trade Binary Option.
Rules of BO - CCI Arrow with Alert below:
A. Setup Menu
1. cciLength:
* Default CCI lenght = 14
2. Linear Regression Length:
* Periods to calculate Linear Regression of CCI,
* Default value = 5
3. Extreme Level:
* Default top extreme level = 100
* Default bottom extreme level = -100
4. Filter Length:
* Periods to define highest or lowest Linear Regression
* Default value = 6
B. Rule Of Alert Bar
1. Put Alert Bar
* Current Linear Regression Line created temporrary peak
* Peak of Linear Regression Line greater than Top Extreme Level (100)
* Previous Linear Regression is highest of Filter Length (6)
* Previous Linear Regression is greater than previous peak of Linear Regression Line
* Current price greater than previous low
* CCI(14) less than Linear Regression Line
2. Call Alert Bar
* Current Linear Regression Line created temporrary bottom
* Bottom of Linear Regression Line less than Bottom Extreme Level (-100)
* Previous Linear Regression is lowest of Filter Length (6)
* Previous Linear Regression is less than previous bottom of Linear Regression Line
* Current price less than previous lhigh
* CCI(14) greater than Linear Regression Line
B. Rule Of Entry Bar and Epiry.
1. Put Entry with expiry 3 bars:
* After Put Alert Bar close with signal confirmed, put Arrow appear, and after 3 bars, result label will appear to show win trade, loss trade or draw trade
2. Call Entry with expiry 3 bars:
* After Call Alert Bar close with signal confirmed, call Arrow appear, and after 3 bars, result label will appear to show win trade, loss trade or draw trade.
3. While 1 trade is opening no more any signal
C. Popup Alert/Mobile Alert
1. Signal alert: Put Alert or Call Alert will send to mobile or show popup on chart
2. Put Alert: only Put Alert will send to mobile or show popup on chart
3. Call Alert: only Call Alert will send to mobile or show popup on chart

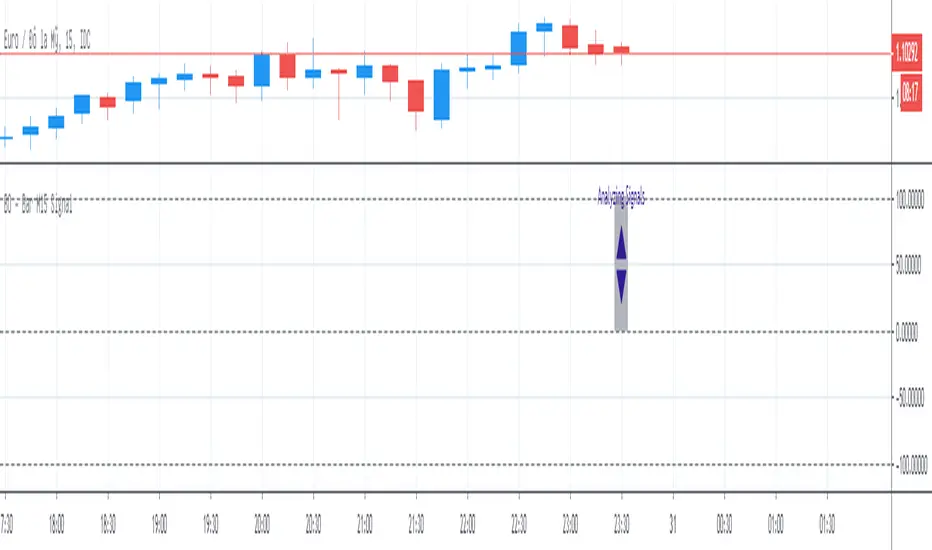
BO - Bar M15 Signal* This script show the signal base on volatility of previous bar M15 to trade Binary Option.
* Rule of Signal is below:
A. Rule 1: Wait for prices created temporary peak and bottom
Row 18: 10 minutes till close
B. Rule 2: Reversal previous bar's direction
1. Put Signal - Row 22 - 25:
- Delay 5' after bar M15 open
- previous bar's direction is upward
- price less than previous close
- temporary bottom greater than previous open
2. Call Signal - Row 29 - 32:
- Delay 5' after bar M15 open
- previous bar's direction is downward
- price greater than previous close
- temporary peak less than previous open
C. Rule 3: Follow previous bar's direction
1. Put Signal - Row 37 - 40:
- Delay 5' after bar M15 open
- previous bar's direction is downward
- price greater than previous open
- temporary peak less than previous peak
2. Call Signal - Row 43 - 46:
- Delay 5' after bar M15 open
- previous bar's direction is upward
- price less than previous open
- temporary bottom greater than previous bottom
BO - KBSignalBO - KBSignal show Put or Call Signal inoder to trade Binary Option.
A. Indicators
1. Keltner Channel %K (indicator was published in my scripts)
2. OBV's %B (indicator was published in my scripts)
B. Rule of Signal
1. Rule 1: No Signal
- %K is the highest of 3 periods => Possible a Pivot High
- %K is the lowest of 3 periods => Possible a Pivot Low
- Previous %K is greater than or equal 0.8 => Touch Resistance Zone
- Previous %K is less than or equal 0.2 => Touch Support zone
2. Rule 2: Sell and Buy Zone depend on 2 Indicators mentioned in A
- Sell zone = %K<0.45 and Obv's %B <0.45
- Buy zone = %K>0.55 and Obv's %B >0.55
3. Rule 3: Put and Call Signal
- Put Signal = Sell zone and not No Signal
- Call Signal = Buy zone and not No Signal
C. Alert
1. Signal alert = Put Signal or Call Signal alert
2. Put alert = Put Signal alert
3. call alert = Call Signal alert
yutas_BOindicator2Ver .1.0
High-low sign indicator for binary option only.
バイナリーオプション専用ハイローサインインジケーター。
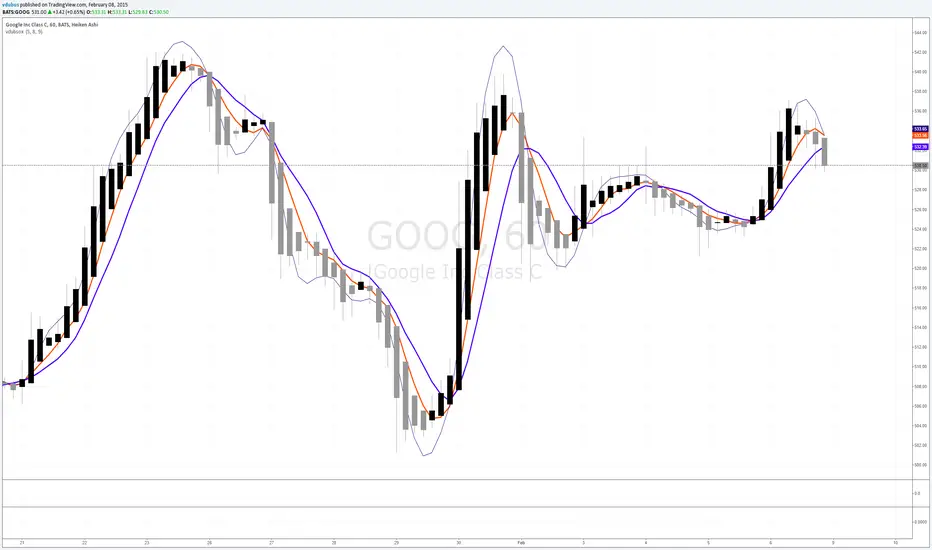
vdubsoxI've been asking for this concept for a while, a simple MA that rides the top side of the trend instead of the bottom, and by accident came across the 'Hull ma' on a TV blog post. I've added another two simple Moving averages to act as strength indicator with close proximity to the price.
The strategy is simple MA cross over but with the early indication using Hull ma gives you a heads up on trend / price reversal.
I'm using this in conjunction with BB set at 34. on a 1/3/5 min charts & Heiken Ashi to smooth out the noise with awesome success trading Binary options.
MAGISTR Binary 3 EURUSD 1min The indicator is designed for use in binary options trading.
Designed for TF 1 minute, EURUSD pair (tested on Currency.com exchange instrument).
When the rules of the internal algorithm are triggered, the indicator generates a signal with the probable movement of the instrument on the next bar:
if a green bar appears at the bottom of the bar, it means that the indicator assumes that the next bar should close at a positive price growth value (it will be green) and vice versa, if a red bar appears at the bottom of the bar, then the indicator assumes that the next bar should close at a negative price growth value( will be red), the indicator also generates appropriate alerts about the expected price movement on the next bar.
In addition, the indicator counts the signals issued by it and the success of its processing for the period of time available in TradingView.
This indicator uses a set of values of such basic indicators as:
- Stochastic RSI;
- Bollinger Bands;
- Profile of Volumes;
- CCI;
- ADX;
- momentum;
and others.
I left all the settings "open", so it is quite possible, by slightly changing the parameters, to adjust it to another pair or time frame.
==========================================================================================================================
Индикатор разработан для применения в торговле на бинарных опционах.
Разработан для ТФ 1 минута, пара EURUSD (оттестирован на показателях инструмента биржи Currency.com).
При сработке правил внутреннего алгоритма - индикатор выдает сигнал с вероятным движением инструмента на следующем баре :
если появилась зеленая полоса внизу бара - значит индикатор предполагает, что следующий бар должен закрыться в положительном значении роста цены ( будет зеленым) и наоборот, если появилась красная полоса внизу бара - значит индикатор предполагает, что следующий бар должен закрыться в отрицательном значении роста цены( будет красным) , также индикатор выдает соответствующее оповещения о предполагаемом им движении цены на следующем баре.
Кроме того индикатором ведется подсчета выданных им сигналов и и успеха его отработки за доступный в TradingView период времени.
В данном индикаторе используются комплекс значений таких базовых индикаторов, как:
- Stochastic RSI;
- Bollindgers Bands;
- Profile of Volumes;
- CCI ;
- ADX;
- Momentum ;
и прочие.
Все настройки оставил "открытыми", так что его вполне можно, немного изменив параметры, подстроить под другую пару или тайм-фрейм.

Binary KillerThis Binary Options strategy is for the 1-minute timeframe and utilized the martingale strategy. If it does not win the first one, and there is a signal to re-enter, 2.5x your trade amount and enter. (The most I have seen this strategy lose is four times in a row.) If you follow the signals, you are looking at a very high win percentage (relative term) when you combine the re-entries for the win.
1. Set alerts on ONCE PER BAR, do not set for bar end.
2. Once the alert signals, go to the chart and watch to make sure the signal CLOSES at the end of the candlestick. (While you are doing this you should have your binary options broker up, setting up your trade. Make sure you start your trade small. Nobody ever went broke taking a profit)
3. Set your trade time for 1 minute, enter as soon as the candle CLOSES, and the signal is confirmed. (It will go away if it is not a confirmed entry, DO NOT enter if the signal goes away)
4. If the trade is losing, look for a re-entry signal, enter at the close of the candle. Continue as long as you get signals or until you win.
*Trade this at your own risk, it is a risky strategy, know your limits, and do not overtrade. Get a few wins and get off.
Try not to mess with the settings too much, these are optimized for every forex pair.
This indicator is a combination of Bolinger Bands, Stoch, and RSI methods to ensure the best possible entry.

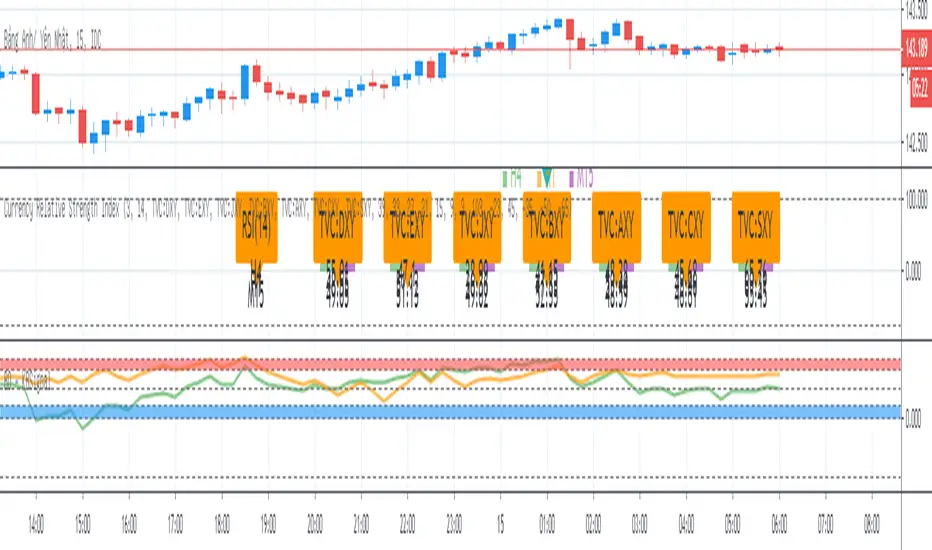
ADX signal Binary Options System by Hashtag_binary ADX signal Binary Options System is amanual trading system trend-momentum high/low. This system is still really interesting to use for binary options and trading without binary.
- Time Frame 15 min or higher.
- Expiry time 2-4 candles.
- Markets: Forex (Currency pairs: Majors; Index: S&P 500, Dow Jones, DAX, FTSE).
Trading rules ADX signal Binary Options System
Buy call:
1. The Moving Average line (14) is above others two Moving Averages (60 and 100 red and magenta line).
2. The TrendSignal Bar first subwindow indicator with bar green.
3. Stochastic is above 50 level.
4 If the previous conditions are agree when appear ADX green arrow you can enter buy call.
Buy Put:
1. The Moving Average line (14) is below others two Moving Averages (60 and 100 red and magenta line).
2. The TrendSignal Bar first subwindow indicator with bar red.
3. Stochastic is below 50 level.
4. If the previous conditions are agree when appear ADX red arrow you can enter buy put.
Exit position for trading without binary
Time Frame H1 and 30 min place trailing stop 15 or 20 pips, 4H time frame place trailing stop 30-40 pips depends by currency pairs.
Initial stop loss on the previous swing High/Low.

BO - Bar M15 2/3 SignalBO - Bar M15 2/3 Signal show the signal to trade Binary Option with rule below:
A. Indicator
* Bollinger Band (20,2): avoid waterfall
B. Rule of Signal
1. Rule1: Split Bar M15 to 3 part and load them on M5 chart (recommend use M5 IDC chart)
2. Rule 2: Delay 10' after bar M15 open => wait for price's pattern
3. Rule 3: Put Signal row 30-32
* Delay 10' after bar M15 open.
* Direction of 1/3 and 2/3 Bar M15 is upward
* close of 2/3 Bar M15 below upper band Bb(20,2) on M5 chart => avoid strong buy
4. Rule 4: Call Signal row 36-38
* Delay 10' after bar M15 open.
* Direction of 1/3 and 2/3 Bar M15 is downward
* close of 2/3 Bar M15 above lower band Bb(20,2) on M5 chart => avoid strong sell
C. Recommend Expiry time: Bar M15 close
* We try to catch the shadow of Bar M15 but dont trade when price run on the upper or lower band of BB(20,2,M5)

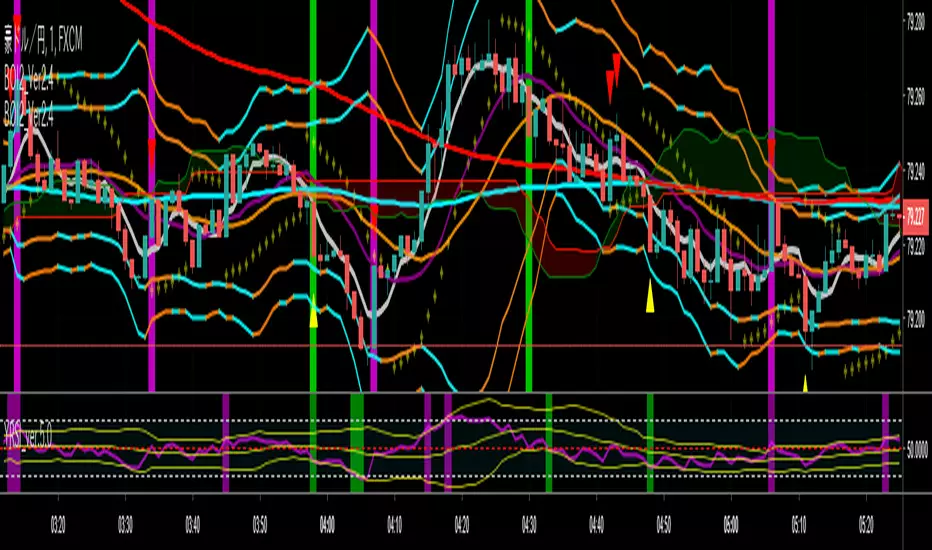
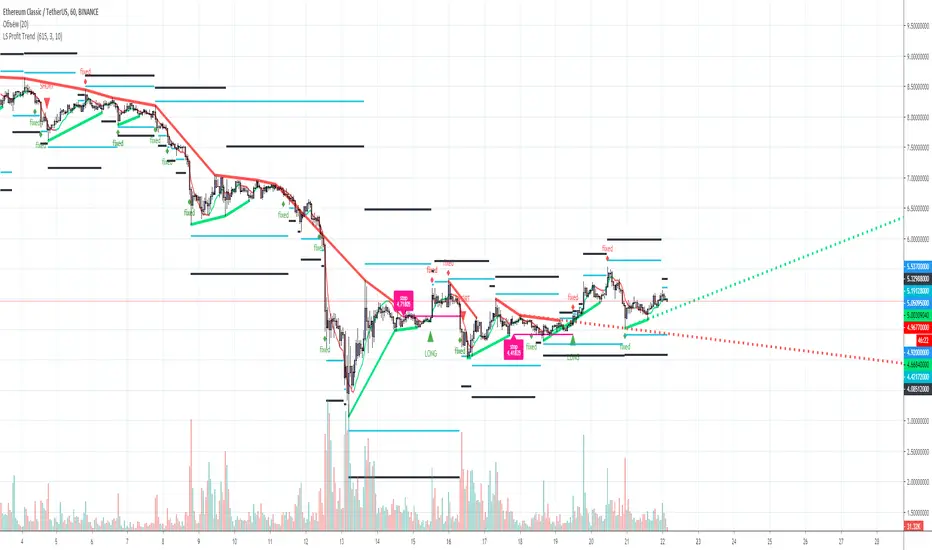
L&S PROFIT TREND Trend indicator for TF from 1 hour and above, for any trading pair, any exchange, binary options. Signals+ Take profit levels. 90% good signal and take profit 1.
yutas_BOindicator2βVer1.0
High-low sign indicator for binary option only. (β version)
バイナリーオプション専用ハイローサインインジケーター。 (ベータバージョン)

yutas_BOindicator_β1Ver1.0
High-low sign indicator for binary option only. (β version)
バイナリーオプション専用ハイローサインインジケーター。 (ベータバージョン)
